Project Overview
The MLB Lineup Analyzer is an interactive web application my team and I built to explore how different Major League Baseball players would perform together in a batting lineup. Using real 2022 MLB Statistics, the app allows user to:
Built their own custom lineup by selecting one player per position
Choose any nine players and let the system automatically generate the optimal batting order
The goal was to create a tool that is simple for anyone to use, even without baseball analytics experience, while still producing a meaningful, data-driven result.
Motivation
Baseball lineups are surprisingly complex. A team’s success depends not only on individual player skill but also how well players are arranged in a batting order. We wanted to build a tool that makes this strategic decision-making accessible and interactive. At the end of the day, our motivation came from three places: curiosity, data exploration, and software engineering practice.
What the App Looks Like
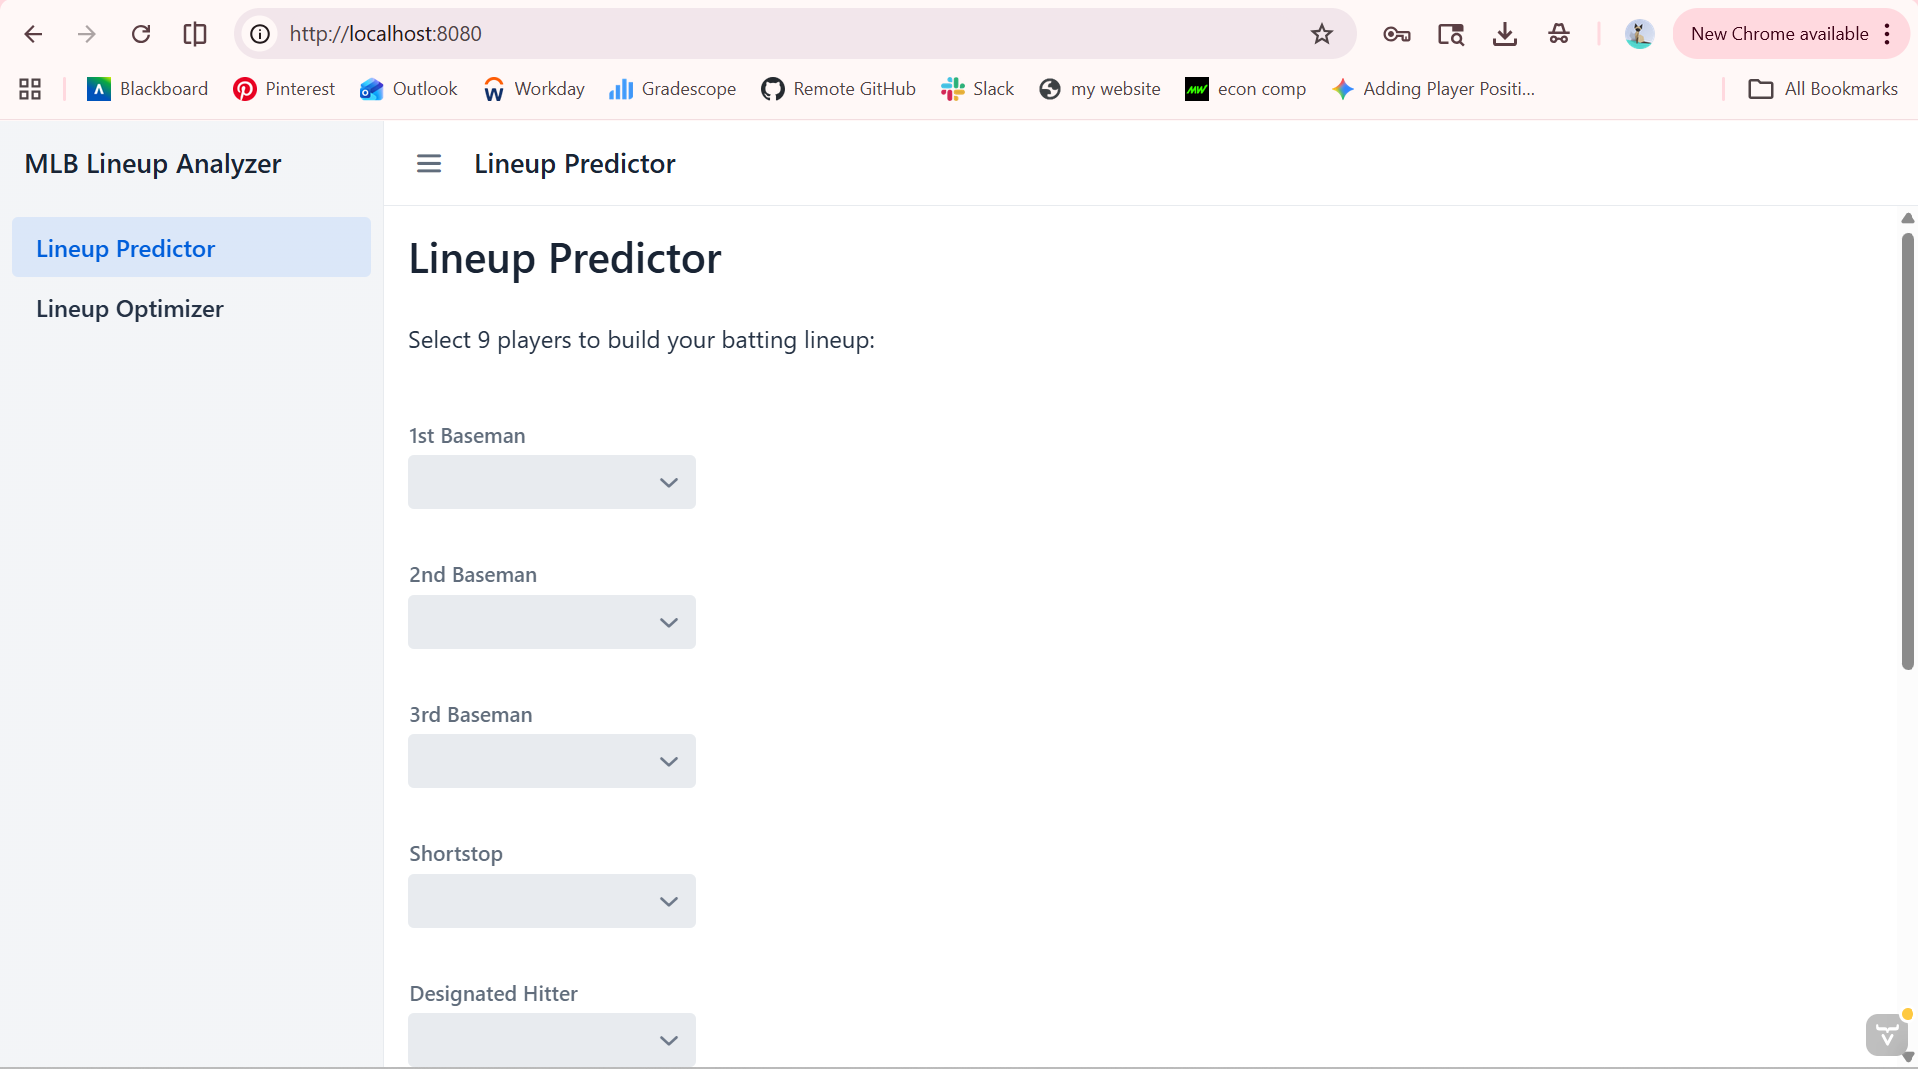
Upon opening the app, you see this ‘Lineup Predictor’ page. On the left-hand side of the screen, you can see two options: Lineup Predictor, and Lineup Optimizer.
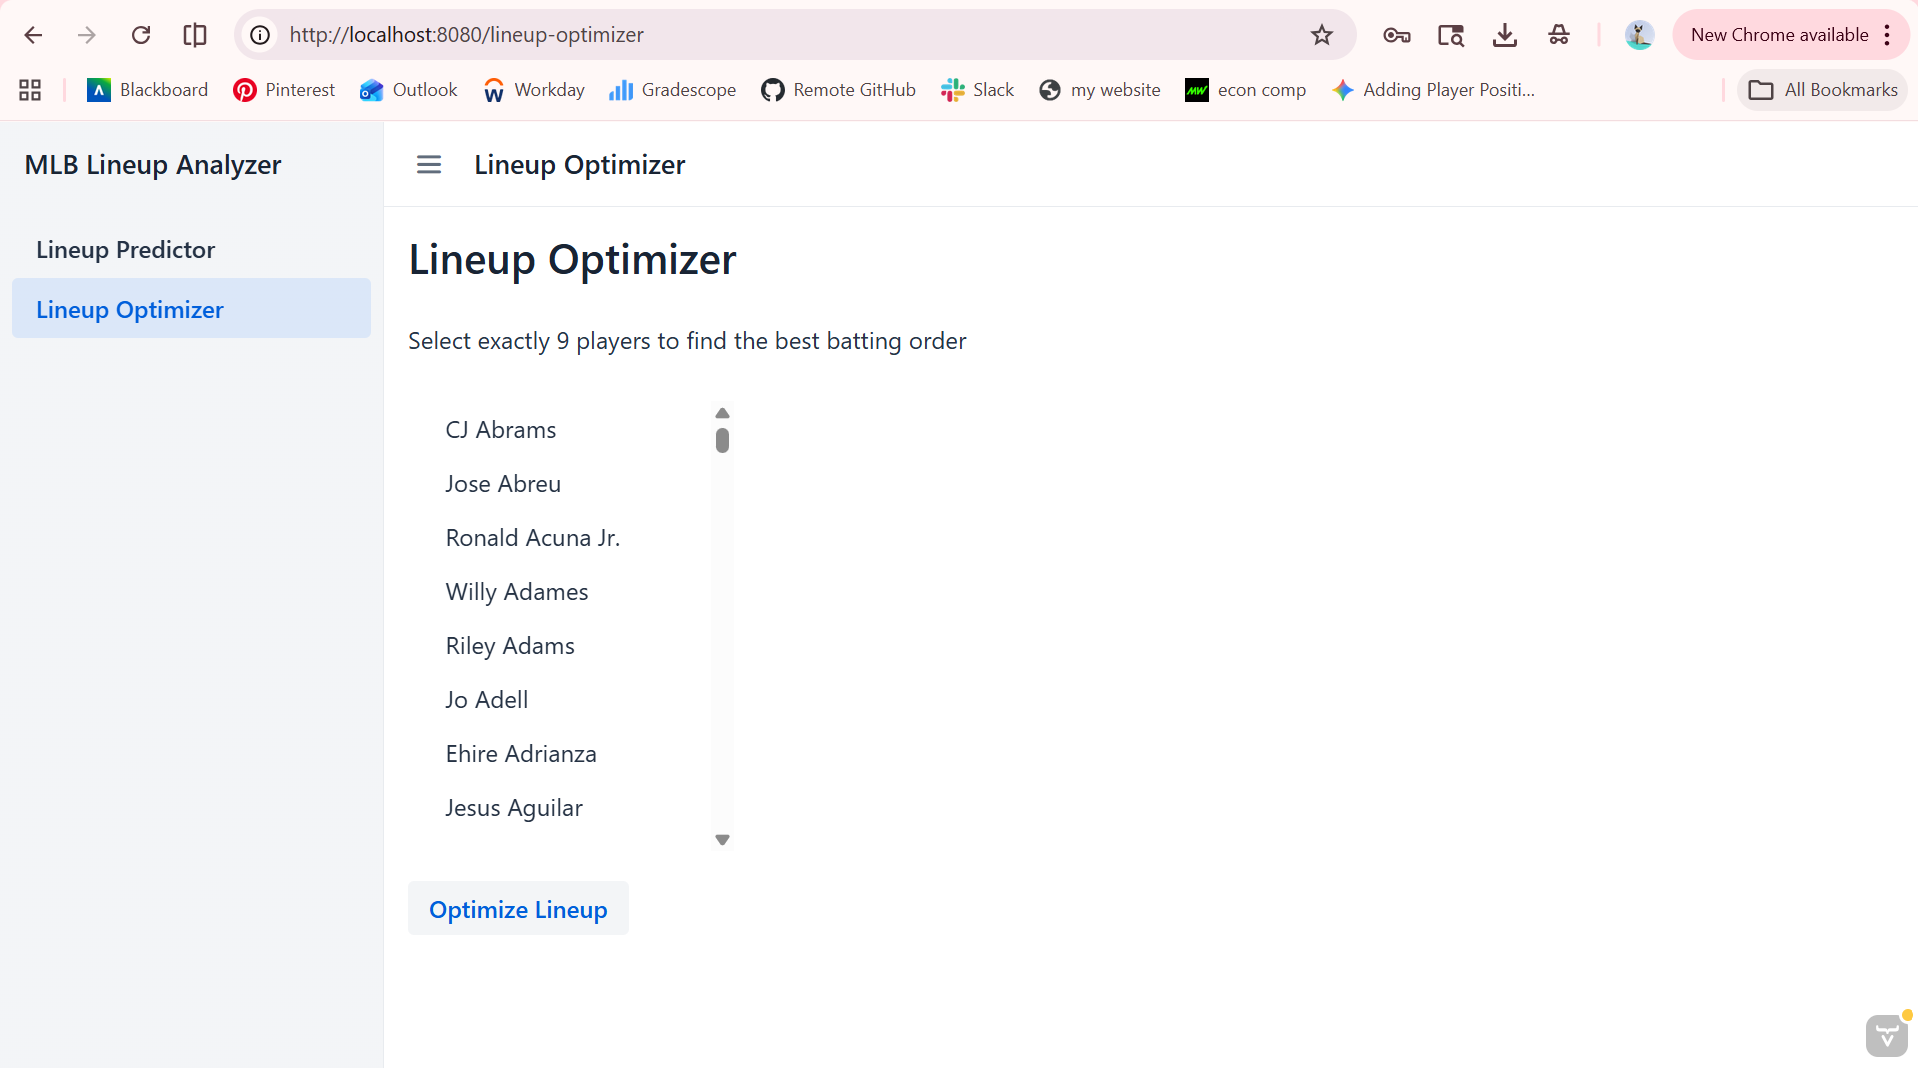
If you toggle with the links on the left-side of the screen, you will be brought to ‘Lineup Optimizer’.
How the App Works
We designed the app to feel simple on the surface, but behind the scenes it uses several layers of logic:
Cleaned and Prepared MLB Data
We started with the 2022 MLB dataset from Kaggle. We cleaned it by:
Removing duplicate rows
Normalizing player names
Filtering out players with zero plate appearances
Adding a position column
This ensures the UI dropdowns only show valid players for each position.
Offensive Score Calculation
When a user builds a lineup in ‘Lineup Predictor’, the app calculated a predicted “offensive score.” This score is based on four key stats:
OBP (on-base percentage)
SLG (slugging percentage)
HR (home runs)
BB (walks)
We weighted these stats based on how strongly they contribute to run scoring. Higher score = stronger lineup.
Lineup Optimization
If the user chooses the Optimizer tool:
They select any nine players
The app generated thousands of possible batting orders
Each order is scored
The highest-scoring lineup is returned
This gives the user a data-driven “best possible” batting order.
Web Interface
We built the UI using Vaadin, which allowed us to create:
Dropdown menus filtered by position
A multi-select list for choosing players
A clean layout with a sidebar menu
Automatic display of results and predicted scores
The app runs locally and opens directly in the browser.
Key Findings
While testing and experimenting with the tool, we noticed several interesting patterns:
OBP is the strongest predictor of lineup success.
Players who reach base often dramatically increase the score.
Power hitters matter most in the top four spots.
Our scoring model gives a small bonus to early batting positions, reflecting real MLB strategy.
The optimizer often finds non-intuitive lineups.
Sometimes, the “best” batting order is different from what you’d expect based on reputation alone.
Lineups with balances skills outperform lineups with one superstar.
A team of nine solid hitters beats a team with one elite hitter and several weak ones.
What I learned
This project strengthened my skills in:
Data cleaning and preprocessing
Building a predictive model
Java backend development
UI design with Vaadin
Working with real-world sports data
Team collaboration and version control
It also taught me how important it is to design software that is both functional and intuitive for users.
Final Thoughts
The MLB Lineup Analyzer was one of the most rewarding projects I’ve worked on. It combines data science, sports analytics, and full-stack development into a single interactive tool. While it isn’t meant for professional use, it provides a fun and insightful way to explore baseball strategy and understand how different players contribute to a lineup.